How to add responsive & interactive world map on your website easily with Google GeoChart tool
A couple of months ago, my friend showed me a website featuring an interactive world map displaying the organization’s locations all over the world as well as their number of employees in each location. After a little of digging, I’ve found that it’s not hard to replicate such interactive world map on my site. At its core, the world map is powered by Google visualization tool, and all you need to do is do re-use their code and a little bit of tinkering to customize the map fit your purpose.
Note that this is not using the image map/hotspot — when you add a static image (of the map) and slice it into different region then add the mouseover code to create the effect.
Demo/Example of Interactive World Map
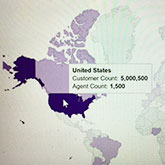
For demonstration, below is the interactive world map for a fictitious insurance company. The map highlights countries where the company has offices together with information about number of clients and number of agents it has in that country.
- Data points: I chose to display 3 data points (country name, client count and agent count), but you can display as many data points for as many countries as you want.
- Countries: Although I displayed 20 countries, you can display as many countries as you want to as long as you have data for the country (and use the correct country name), the country will be highlighted.
- Colors: I used different shades of purple for colors, but you can use your own colors. Google will use darker shade for countries with higher number and lighter shade for countries with lower number. The selection is somewhat automatic.
- Size: You can scale it as big as you want to fit your webpage. For the example, I made it responsive with the max height of 400px.
Pretty cool, isn’t it? Here’s the detailed explanation.
Create Interactive Map Explained
The code used for the map is pretty self-contained, so you can copy the whole code I used in the example, and it should work. There’s no need to have additional Javascript library or something like that.
Code used in the demo:
There’re many lines in the code above, but basically we can break it down into a couple main parts that you can customize. My suggestion is to first copy the code above and use it as is on your website to make sure everything works, then add any customization you want later.
- Empty container: This container is just an empty div with an id. The code will then dynamically place the map inside this div. If you decide to change the id, you’d need to change it here, and also change in another place inside the code near the end.
- Javascript: The whole code is powered by javascript with a link to an external javascript hosted by Google. Again, the code uses some variables, and if you decide to change the variable name, you’d need to update it everywhere else. My recommendation is not to change it at all.
- Map data: Map data is put inside another javascript function and presented in a json-type format. Actually, you don't need to know what it is. Just need to keep the format, and replace the text/data properly, and things will work.
- Map colors and other options: Adding color options in the format like below. Again, you can specify individual colors, but Google will decide what color to use for what country depending on the data value.
You can also specify the width and height of the map. I put it in there for your reference, but for the map to be responsive, I didn't add width and height in the example.
Making Your Interactive World Map Responsive
Out of the box, the map and other Google GeoChart tools are not responsive - at least at the time this article was written. They likely look good on desktop but not on a mobile device. To make your interactive world map adjust its size automatically to fit different device screen sizes, you just need to add some line of codes below - assuming that you're using jquery on your site; if not, it's pretty easy to convert to regular javascript. Basically you need to call the drawRegionMap() function whenever the screen size is change.